FLOTATION WEB APPLICATION: 2X ROUGHER-CLEANER MASS BALANCE
The below calculations apply to:
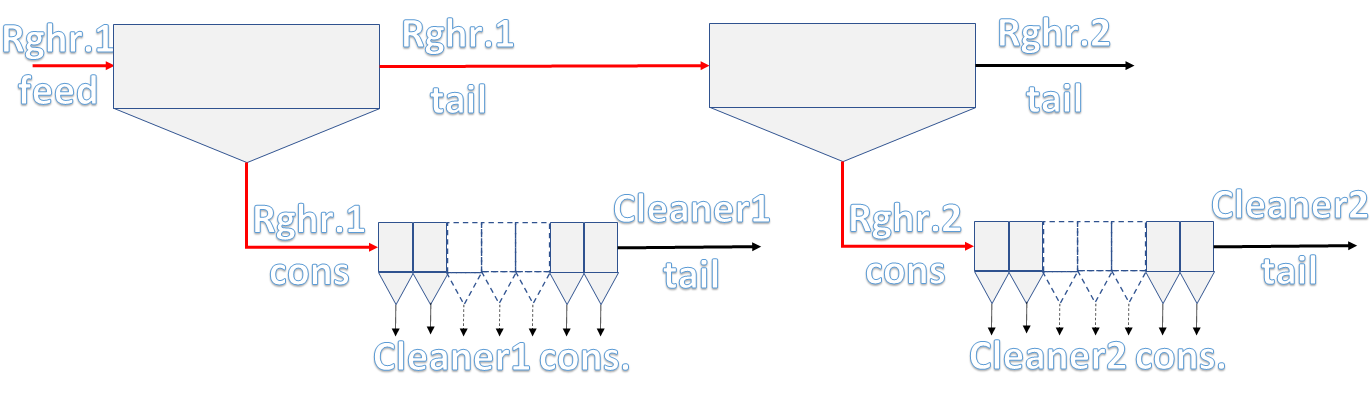
Two rougher-cleaner circuits described by he flowsheet below (e.g., sequential lead-zinc rougher-cleaner flotation tests) .
The two rougher circuits concentrate and feed streams are calculated from the cleaners concentrates and tailing. To use:
Replace the provided example data or follow the steps below.
Enter the rougher 2 tailing name, weights and assays (no flotation time). Make sure you delete the "rougher 2 concentrate" data before recalculating.
Enter the cleaners 1 and 2 concentrates and tailing names, concentrates flotation time, weights and assays.
The flotation times are not cumulative (no flotation time for both cleaner tailings).
Select the value element/mineral to plot the selectivity curves for each cleaner circuit.
Provide one element/mineral grade at which cumulative recoveries for each cleaner circuit should be tabulated.
Provide one element/mineral recovery at which cumulative grades for each cleaner circuit should be tabulated.
Specify if the flotation kinetics are to be calculated for each cleaner circuit (using regression techniques).
Click on "Mass balance" button to calculate the cumulative data and plot graphs.
Click on "Download results in Excel" button to save the results.
The cumulative recoveries are calculated with respect to each circuit feed.
The calculation of iron sulphide (IS) and non sulphide gangue (NSG) assays can be completed at the Metallurgical.App website.
Cleaner 1 graphs
Cleaner 2 graphs
WITH THE GRAPHS:
Single click on one data series from the legend to view/unview it.
Double click on one data series from the legend to show only one series.
Double click again to show all data series.
You can also edit the graphs' titles, axes titles, zoom in, zoom out, pan, auto-scale and export the results using the toolbar at the top of each graph.